Employee Expense Reimbursement Service for Subsidiaries in Japan
Employees' expenses are processed in four simple steps that provide tight control and rapid reimbursement using a web browser. Your employees, your accounting department, and your managers each have reports specifically tailored to their requirements.
Employees enter expenses using a web browser, write the system provided expense number on the receipt, and mail to HTM in a prepaid self-addressed envelope.
HTM matches the receipts with the employee entered expenses. Each expense is then given an Admin Approval or electronically returned to the employee with the reason for the return.
Items with Admin Approval appear in the Manager's browser for the Manager's Approval. Items can be either approved or returned with the reason for the return.
Approved expenses are reimbursed by transfer to the employee's bank account. Reimbursements are done once a week.
The Employee Report keeps employees' informed as to which expenses have been entered and which have been paid.
The Accounting Report provides your accounting department, with all the details classified to your accounting codes.
Log into the Business Information Portal which provides management with a series of real-time web-based reports from a summary over any time period down to individual transactions.
Employee Expense Reporting
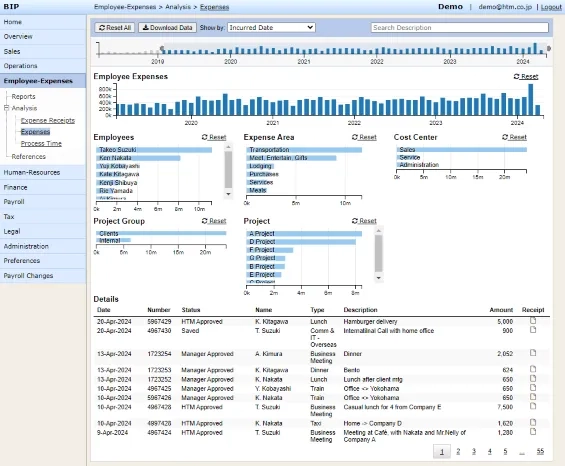
The Business Information Portal (BIP) provides an interactive view and a one page accounting of all expenses by employee, expense area and type, project and cost center.
Comprehensive Breakdown
Pictured here is the Comprehensive Breakdown view of employee expenses. It is broken down by month, employee, expense area, project group, project and cost center.

View Years Of Data

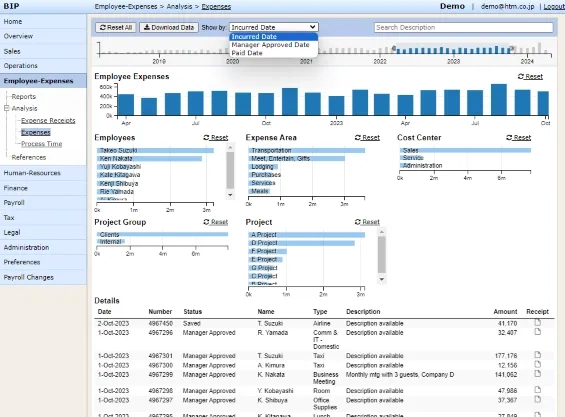
Using the range of time filter, it is possible to set any possible time frame. Also, we can show and filter expenses by incurred, manager approved and paid dates.
Drill Down and Expand
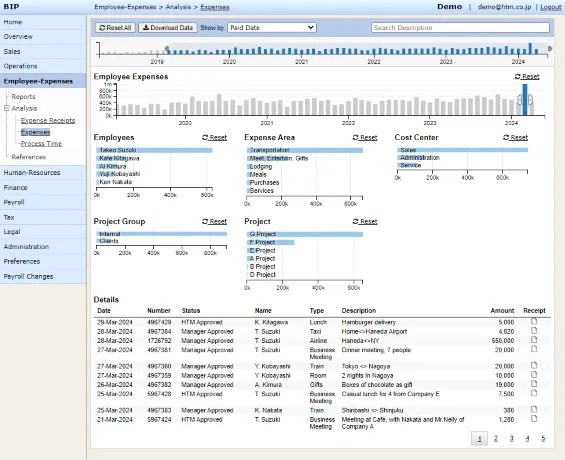
To get into more detail click the bar and the entire dashboard will filter to that month. Here we clicked March 2024 and all other windows are now showing data for only March 2024. In the expense group window, we can also expand the groups to view by individual categories.

Single Transactions in 3 clicks

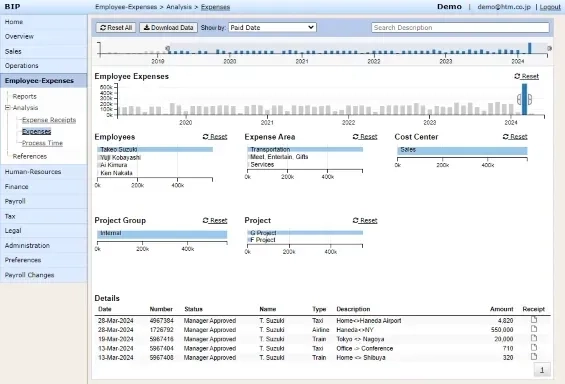
We can see that Takeo Suzuki's transportation expenses for March 2024 are quite high. By clicking on Takeo Suzuki and then Transportation, we can view the detaied breakdown of his transportation expenses for the month.
Expense Reporting System Startup
The Expense Reporting System will be set up within a few days after getting your employee and accounting information.
We will need to get a list of employees including bank information for reimbursement, the employees' email addresses, and the manager for each employee.
We will work with your accounting department to understand your accounting codes. By using your accounting codes, the Expense Reporting System will provide you an accounting report that is makes it easy and accurate to transfer the monthly accounting information to your corporate accounting system.
We will train your employees to use the system, and your managers to get the information needed to understand and control expenses.

 Email us